Say bye, bye to website screenshot stuff. Chrome DevTools 62 are here!
If you’re using any kind of software or browser’s plugin for capturing entire website, viewport areas longer than current screen or just a small pieces of website then with new Google Chrome DevTools 62 you can say bye, bye to all of them!
You can now capture screenshot of selected node (which includes capturing entire page, as I’ll show you) directly in DevTools in Google Chrome 62.
It is said that you can also capture a screenshot of selected part of viewport, but I managed to get this working only two times per ten on less than 10% of websites. Thus, I decided to not write about it.
To capture a screenshot of a selected node of DOM:
- Open (by any means) DevTools in Inspect Element Mode.
- Select desired DOM node, by clicking on it etc.
- Hit Ctrl+Shift+P (or Command+Shift+P on Mac) to open Command Menu.
- Type
nodeand selectCapture node screenshotcommand. - As “Save as” dialog will appear after a while letting you to save captured screenshot to a file (.png file format only).
If you select body DOM node you’ll be most likely able to capture promised screenshot of entire webpage.
Here is an example of an effect of doing so (1423 × 8192 screenshot!):
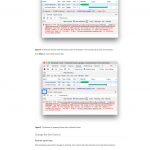
Google Chrome / Chrome DevTools opens a “virtual” window and renders selected node inside it prior to capturing screenshot. Thus, if you select and “unrenderable” node (i.e. <style> tag etc.) you’ll end up with a completely empty viewport and no “Save as” dialog at all.
To end “blackout”, return to your website and force Google Chrome to display contents again (i.e. to not loose your work) simply close DevTools.
You can also capture screenshot of a selected part of viewport, but — as I wrote in an introduction — I failed to make this working reasonable number of time.
